I compile and test SimpleGrid inside a VMware virtual machine
because it is convenient to carry my entire development machine around
on a USB thumb drive and it also make debugging device drivers easier.
Running inside a VM is just like running natively 99% of the time, but
I need to be careful about that odd 1% -- especially when working with
graphics. The VM has to emulate a physical GPU and there are
differences.
I have already run into problems with Direct2D where I need to specify
a SOFTWARE device or some effects will crash. I am running into some
strange behavior with Direct3D and Direct2D interop which may be caused
by the VM.
Graphics performance in the VM is dramatically worse than running
natively, even when compared to the mid- to low- performance of the
integrated Intel graphics on my system. I took some time to measure
the performance of SimpleGrid running inside the VM to running it
natively.
My System
I am running on a Skull Canyon NUC.
CPU
2.6GHz Skylake Core i7-6770HQ quad-core (boost up to 3.5GHz)
GPU
Integrated Iris Pro 580 with 128MB eDRAM
RAM
32GB DDR4 2133MHz
Prep Work
I need to create some scaffolding before I can easily measure the
performance with different parameters.
Command Line
I need to specify the number of vertices in the grid from the command
line, which means adding some minimal text parsing.
I need to collect the performance statistics in the render loop. I
want to record the time required for every frame and report the
instantaneous frame rate for each frame. A simple averaging of the
frame count for every x seconds loses too much information, it is
better to keep a running FIFO of the high-resolution timestamps for
each frame and use that to determine the frame rate.
This requires two records, a timestamp FIFO and a frame rate FIFO,
both constructed from a deque. From this I can calculate the
frame rate by simply taking the number of items in the timestamp FIFO
divided by the expiration period. This frame rate is then stored in
the frame rate FIFO to be used to draw the graph.
Game frame rates:
class Game {
private:
void RenderTime(void);
LARGE_INTEGER clkFreq;
std::deque<LARGE_INTEGER> vecFrameTS;
std::deque<INT16> vecFrameRate;
UINT16 frameRate; //Instantaneous frame rate
};
// Record the instantaneous frame rate for the last 10 seconds.
// I want the actual instantaneous frame rate, not an average.
// vecFrameTS is a FIFO of the high-resolution timestamps for each frame.
// Drop all timestamps that have expired (older than 10 seconds)
// The instantaneous framerate is the number of timestamps in the FIFO.
// The framerate history for the last 1000 frames is stored in vecFrameRate.
void Game::RenderTime(void) {
LARGE_INTEGER clkTick;
QueryPerformanceCounter(&clkTick);
vecFrameTS.push_front(clkTick);
INT64 clkExpire= clkTick.QuadPart - clkFreq.QuadPart*10;
while(vecFrameTS.size()>0 && vecFrameTS.back().QuadPart < clkExpire)
vecFrameTS.pop_back();
frameRate= (UINT16)(vecFrameTS.size()/10);
while(vecFrameRate.size() > 200)
vecFrameRate.pop_back();
vecFrameRate.push_front(frameRate);
}
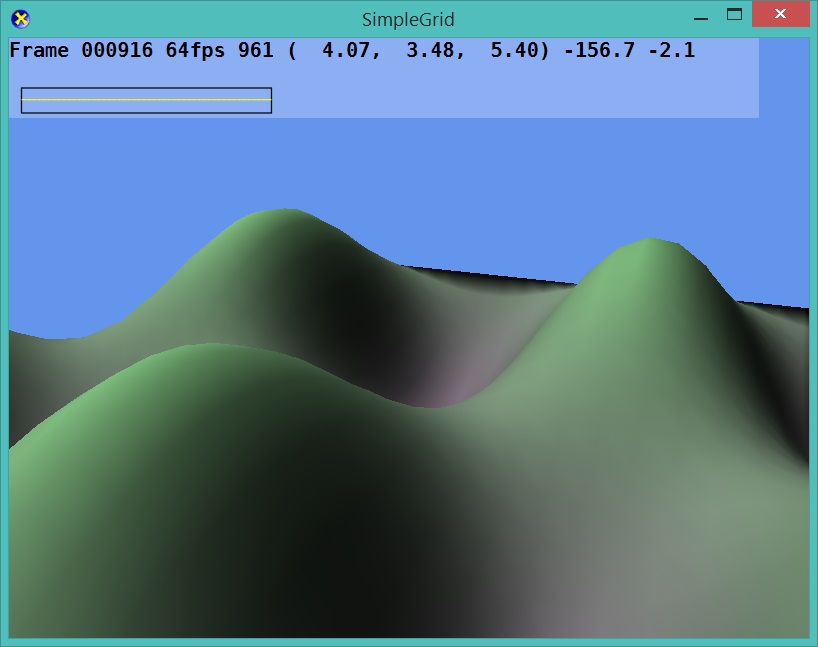
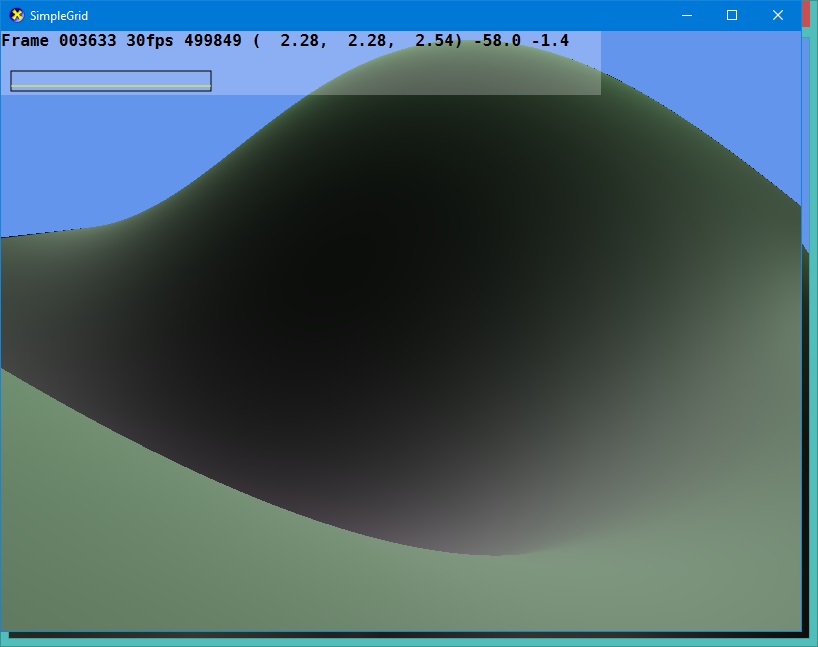
The frame rate information is then presented as both text and a
moving graph. I expanded the D3Text class to draw other 2D primitives,
including lines, rectangles, and filled rectangles. This approach means
I always have a record of both the historic frame rate and the precise
time required for each frame.
I am using SimpleGrid to test performance by setting the number of
vertices in the grid. I use the command line to specify a target for
the total number of vertices but since the grid is always square the
actual number will be something smaller. (Actually int(sqrt(x))^2 )
This does not include the vertices used to draw the sun.
The relationship between vertices and polygons is roughly two
vertices to each polygon. Each polygon is defined by three vertices,
but two of the vertices are usually shared with the previous
polygon.
VM Performance
The VM seems to be using a maximum refresh rate of ~60Hz while running
natively is locked to 30Hz.
Frame Rate
Discrete Draw
TriangleList
Vertices
VM
Native
VM
Native
100
64
30
64
40,000
63
30
64
59,536
54
30
64
79,524
45
30
64
99,856
39
30
64
149,769
28
30
62
224,676
20
30
59
349,281
13
30
51
499,849
10
30
49
599,076
8
30
48
649,636
7
29
46
59
749,956
6
24
FAIL
59
1,000,000
4
19
FAIL
59
1,500,000
FAIL
59
2,000,000
FAIL
59
3,000,000
FAIL
59
4,000,000
FAIL
59
5,000,000
FAIL
51
6,000,000
FAIL
41
7,000,000
FAIL
35
8,000,000
FAIL
32
9,000,000
FAIL
28
Wow! Even a mid-class integrated GPU is able to pump out over 20
million shaded vertices per second! I can safely draw half a
million vertices per frame and sustain 30fps. The VM is nowhere near
this level, topping out at 150K. The good news is that the VM is still
able to render a million vertices, just at a much lower frame
rate.
Amazing! Using a static vertex buffer, I can create a terrain of
9 million vertices before the native frame rate drops below
30fps! Static vertex buffers let almost all the code run on the GPU,
with the CPU used only to update the shape positions and view
point.
This gives me a good framework for estimating how many vertices I can
manage in a game.
⚛
NOTE: Disabling the CPU optimizer drops native performance for
500,000 vertices from 30fps to 12fps! This is yet another reason
why even debug builds should enable the optimizer.
GPU Queries
I can query performance statistics from the GPU using
D3D11_QUERY
requests.
WebV7 (C)2018 nlited | Rendered by tikope in 97.404ms | 216.73.216.79