Tuesday Jan 06 2016
10:47> I had a bit of insomnia and woke up at 5am. I wandered down to the computer around 7am and started poking around DbgOut and instrumenting the Blister Algo code. I couldn't figure out why some of my traces would not show up, and eventually tracked it down to a bug in the Server code that was writing a pointer into a short. Oops. The good news is that fixing this removed the requirement to use gdb. I guess gdb was somehow masking a segfault.
Then I couldn't figure out why all the events on the display were too short, and tracked that down to a bug in the viewer trace scan that was failing to update the state of the channels.
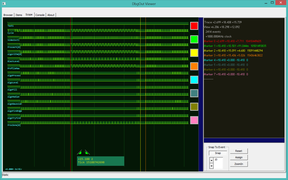
I spent about 3 hours fixing data collection and display bugs, then it took about 2 seconds of looking at the traces to see where the Blister cycles were being consumed: Algo:Image::Profile(). This was a bit surprising, I thought that code was oddly written but should have been straight-forward. But when the pixels are all black, it chews up cycles. I have it caught on film. The traces also make it clear that the rest of the algo code is sidestepped when there is no line.
I think it is fair to say DbgOut has already paid off.
I was tempted to add this function to convert seconds to nanoseconds:
Clever, but on second thought, there is no way it is faster than
just multiplying two 64bit numbers. To test, I added a multiply
suite to the Linux ExConsole.
DbgOut sample application.
ExConsole 1.0.107 1.0.107 [root@blis]
Creating DbgOut interface...
DbgOutCreate: 18.469ms
PrintFast: 7.101ms
TraceFast: 7.950ms
TracePrint: 91.040ms
Multiply Normally: 0.963ms
Final multiply: 99999000000000
Multiply shift/add: 8.690ms
Final multiply: 99999000000000
Destroying DbgOut interface...
Main: 217.372ms
Sample application exit. [0]
Yes, the shift/add scheme takes 10X compared to just letting the cpu
do it. 100,000 64bit multiplications in 1ms, amazing. Gone are the old
days of fearing floating-point operations. This test also exposed a
(viewer:trace:scan?) bug where the first event seems to be dropped or
the trace is initially high.
Thu Jan 07 2015
I spent the day using DbgOut to diagnose problems and to test theories in the BLIS project. Overall, DbgOut was very helpful. But there were some annoying glitches.
The first problem was doubt about whether the marker intervals were being reported accurately by DbgViewer. I need to set the clock to match the nomative frequency, "set clock 1G", every time I open DbgViewer. This needs to be fixed, the information should be in the log. I created a "LongTest" function in ExConsole to provide a test that would give me a method to compare the system time, DbgOut time, and real-world clock time.
The result was positive, the 10 second test period was reported as 10,000.000ms using gettimeofday(), 10,000.162ms by DbgOut, and 10.15s by my thumb on a stopwatch. I believe DbgOut is slightly more accurate than the user-mode version of gettimeofday(). DbgViewer reports 9.999s with the clock set to 1G. So that all checks out OK.
The bad news was that a few events were munged in the log, including
the third LongTest countdown tick. This was reported in the scan log.
Reading from .\DataStore\Item.bin, 219701 bytes...
DBG: Trace:Scan: [1:0] Fast
DBG: Trace:Scan: [2:1] Print
DBG: Trace:Scan: [3:2] Multiply
DBG: Trace:Scan: Bad tick? [1BA480952]
DBG: Trace:Scan: [4:3] LongTest
DBG: Trace:Scan: Bad tick? [1F5FD90DE]
DBG: Trace:Scan: Bad tick? [231B3FF2F]
DBG: Trace:Scan: Bad tick? [26D6B75A0]
DBG: Trace:Scan: Bad tick? [2A9229708]
DBG: Trace:Scan: Bad tick? [2E4D99D67]
DBG: Trace:Scan: Bad tick? [320902710]
DBG: Trace:Scan: Bad tick? [35C47229A]
DBG: Trace:Scan: Bad tick? [397FE6DC6]
DBG: Trace:Scan: Bad tick? [3D2B92565]
DBG: Trace:Scan: Bad tick? [40E53DFC5]
DBG: Trace:Scan: Bad tick? [57F962357]
DBG: Trace:Scan: Bad tick? [5C0902836]
DBG: Trace:Scan: Bad tick? [637C367E1]
DBG: Trace:Scan: Bad tick? [6735C2049]
DBG: Trace:Scan: Bad tick? [6AF1599D1]
DBG: Trace:Scan: Bad tick? [6EA91A642]
DBG: Trace:Scan: Bad tick? [72649D2DE]
DBG: Trace:Scan: Bad tick? [761C791D0]
DBG: Trace:Scan: Bad tick? [798073109]
DBG: Trace:Scan: Bad tick? [7D3A1FF35]
DBG: Trace:Scan: Trace= 240.214ms;
Index complete
4008 visible items.
22 trace blocks loaded.
8062 trace events over +40.827sec at 720MHz
This could be an error in initializing a new trace block in the
Server, writing the block into the datastore on the remote
DbgOutRelay, or scanning the block in DbgViewer. I'll start by
looking into DbgViewer since it is by far the most debug friendly.
Each of these warnings should generate a "Data Continuity Break" event
in the trace data. UPDATE 20160111: The "Bad tick?" messages were
generated by a check for "abnormally" long gaps, which was set to too
low a threshold -- these were false errors. I fixed the "tick
discontinuity" display and disabled the long gap warning. The scan
errors are now very rare.
Mon Jan 11 2016
The DbgOut Linux build relies on the bitbake devshell environment for the kernel module builds. If this is not set, the makefile errors out before building DbgOutRelay. I need to move DbgOutRelay to build before the drivers so I can build all the user-mode stuff without running bitbake first. The alternative is to figure out why the kernel modules fail, something to do with modpost, and fix that.